From monitoring to intelligent action.
Agentic AI for rotating-asset reliability. MotionGrid predicts failure risk months ahead, prioritizes maintenance, and closes the loop with auditable action — on top of the systems you already run.
Visibility alone doesn't prevent downtime.
Traditional condition monitoring shows trends, alarms and anomalies. Teams still spend valuable time asking what matters, what will fail, and what to do next.
Review cadence is weekly or monthly, by a CM engineer.
Warnings arrive in hours to days — rarely sooner.
Outcomes depend heavily on one individual expert.
On many assets, the work still runs as firefighting.
From reactive to proactive — and from days to quarters.
MotionGrid doesn't replace condition monitoring, DCS or offline tools. It adds the long-range layer that is missing.
- Alarm-driven — detect issues late
- Interpret dashboards manually
- Respond after escalation
- Predict failure risk with lead time
- Prioritize what needs attention
- Trigger timely, auditable action
Ask the system. Get asset-specific answers.
Motion AI turns complex asset data into a conversational experience — no dashboards to learn, no queries to write.
↳ Click a prompt — or type your own in the chat.
Every answer carries its evidence and history.
Sits on top of your stack. No rip-and-replace.
MotionGrid ingests the data you already have and closes the loop back into the systems your teams already use.
Ingests what you have
Sensors, SCADA, historian, inspection data and CMMS.
Adds asset context
Signal analytics, thresholds, BEP and trend features.
Predicts, then explains
Failure scoring and rules, surfaced through Motion AI.
Closes the loop
Technician updates return to the models as learning.
Run the asset to the planned shutdown, not to failure.
Every monitored asset carries a quantified probability of failure and a remaining-useful-life estimate with model confidence attached — placing the work inside the next planned shutdown, using the service life you have already paid for.
Prediction becomes action. Action becomes learning.
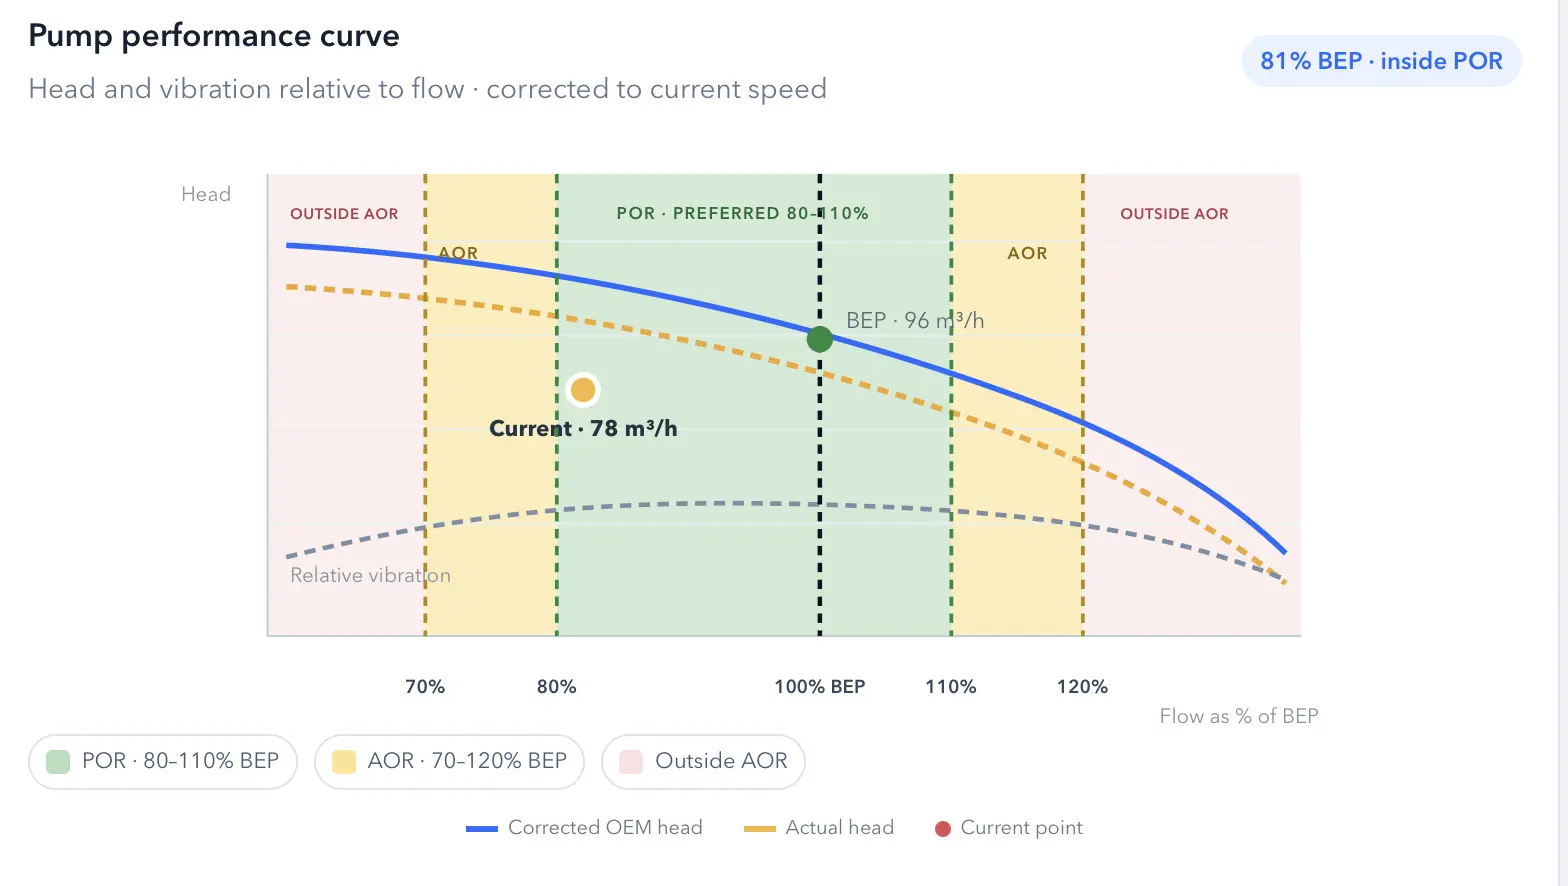
See how far the pump is from its best operating point.
MotionGrid compares actual flow and head with the corrected OEM curve, then shows the specific operating change required to return the pump to its preferred operating region.
CO₂ avoidance from efficient operation.
MotionGrid estimates emissions avoided when an asset uses less electricity after operating closer to its best efficiency point. The calculation is simple, transparent, and configurable for the local electricity grid.
How the estimate is calculated
Illustrative result. Reported CO₂e should use the facility’s approved electricity emission factor and the same measurement boundary for baseline and optimized energy.
When the value arrives.
Value compounds as coverage grows. Each phase has something measurable attached, so a pilot can be judged before the twelve months are up.
Connect and baseline
Existing data is ingested and assets ranked by criticality. Baseline MTBF is established per asset — the reference every later figure is measured against.
First predictions
Degradation is forecast ahead of symptom. Work orders start being raised from prediction rather than from alarm, and sync to your CMMS.
Measurable shift
Corrective work converts to planned. The KPI movement shows up in your own reporting, on your own assets.
Ranges observed on comparable programmes. Supporting MTA, CO₂ reduction and availability.
Built for rotating equipment.
Oil & gas
Keep critical trains turning between turnarounds.
Petrochemical
Protect continuous production from rotating-equipment trips.
Refineries
Avoid unplanned turnaround surprises.
Gas processing
Sustain throughput across compression trains.
Fertilizers
Keep ammonia and urea trains on-stream.
Drilling rigs
Offshore units run 70–140 pumps each — every one monitored.
Turn asset data into action.
A scoped pilot on a set of critical assets, targeting 60–90% coverage within twelve months — on the data you already collect.
Book a demo
We'll show failure-risk scoring, RUL and Motion AI on your own equipment.
Opens your email client addressed to info@motiongrid.uk
Almost there
Your email draft is ready — hit send in your mail client, or write to info@motiongrid.uk directly.